Financial statements tell a powerful story about your business. However, they can seem like an overwhelming collection of figures without proper analysis. Financial benchmarking studies can help you identify historical trends, pinpoint areas for improvement and forecast future performance with greater confidence.
Gauging Profitability
Profitability ratios help evaluate how effectively a company generates profits from its revenue. These metrics are crucial in assessing operating performance and the effects of economic or industry forces. Examples of key profitability ratios are:
Gross margin. This ratio is the percentage of revenue remaining after deducting the cost of goods sold; it reflects how effectively a company controls direct costs, such as materials and labor (aka efficiency).

Net profit margin. This shows how much of each dollar in revenue turns into net income after all expenses, including taxes and interest. Use this formula for overall profitability.

Earnings per share. Investors often use this metric, which assesses profitability on a per-share basis, to gauge a company’s operating performance. This benchmark is a crucial metric for shareholders.

Beyond these top-level indicators, a deeper dive into individual income statement line items can provide additional insights into financial performance and cost control. Key operating expenses to evaluate include rent, payroll, commissions, owners’ compensation, utilities and interest.
Optimizing Resources
Liquidity refers to a company’s ability to meet short-term obligations. Commonly used liquidity ratios include:
Current Ratio. This is the ratio of current assets to current liabilities. It measures a company’s ability to pay short-term obligations with short-term assets. A ratio >1 generally indicates good short-term financial health.

Quick Ratio (Acid-Test Ratio). Only considers cash and other assets that you can readily liquidate, such as accounts receivable. It excludes inventory which may not be quickly converted to cash.

Days in Receivables Outstanding or Days Sales Outstanding (DSO). Estimates the average collection period for credit sales. Often calculated monthly, quarterly, or annually (e.g., 30, 90, or 365 days).

Days in Inventory Outstanding (DIO). Estimates the average time it takes to sell a unit of inventory. Lower DIO often means more efficient inventory management.

It’s also important to consider long-term assets, such as equipment, with the total asset turnover. This ratio tells how many dollars in revenue a company generates from each dollar invested in assets. It’s particularly relevant for capital-intensive businesses that invest heavily in equipment, property and other long-term assets. Striking the right balance between lean operations and maintaining enough working capital to meet customer demand and supplier expectations is critical to long-term success. A higher ratio indicates better asset utilization.


Balancing Financial Leverage
Debt can be a powerful tool for growth, but excessive amounts can expose a company to financial distress. Debt management ratios help businesses assess their ability to handle existing obligations and determine whether they can responsibly borrow more money. Some short-term leverage metrics include:
Times Interest Earned or Interest Coverage. This ratio evaluates a company’s ability to cover its interest payments with earnings before interest and taxes. A ratio of >1 means the company earns enough to cover interest.

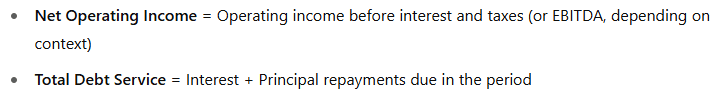
Debt Service Coverage. This metric compares available cash flow to total debt obligations, providing a broader picture of a company’s repayment capacity than the times interest earned ratio. A DSC ratio >1 means the company generates enough income to cover its debt payments.

For long-term stability, companies must also monitor the debt-to-equity ratio, which reflects how much of their assets are financed through long-term debt versus shareholder equity. Businesses seeking financing must carefully analyze these metrics to understand how lenders might perceive their financial health. A higher ratio implies greater financial leverage (and risk).

Putting Ratios in Context With a Financial Scorecard
Comparing current results to historical performance can reveal whether a company is improving or facing new financial challenges. Benchmarking against industry averages provides a broader perspective, helping business owners understand how they measure up to competitors. Similarly, comparing financial ratios to peer businesses of similar size and structure can highlight potential inefficiencies and competitive advantages.
To make the most of financial benchmarks, consider creating a financial scorecard based on year-end financials and updating it regularly using preliminary numbers. This approach provides a proactive way to track financial performance throughout the year, make informed decisions and address minor issues before they become major problems.
Maximizing Your Business’s Potential
Many business owners and managers struggle to extract meaningful insights from their balance sheets, income statements and cash flow reports. However, interpreting financial data doesn’t have to be overwhelming. Contact us to explore the right metrics for your business and discover how you can transform raw data into a strategic roadmap for success.